Data strategy and architecture
Choose the decisions worth improving, agree who owns them and set an evidence-led roadmap for the data work.
We help UK businesses make sense of scattered operational data. First we define the decision and test the source records. Then we build the smallest reliable data product that can support it.
Choose the decisions worth improving, agree who owns them and set an evidence-led roadmap for the data work.
Build tested pipelines, warehouse or lakehouse models that keep operational records dependable, reusable and ready for forecasting or AI.
Replace recurring spreadsheet work with shared metrics, useful reports and alerts that reach people in time to act.
Make definitions, ownership, lineage and known limits visible. Set practical controls for quality, access, retention and change.
Different systems can own different records. We make the source, definition and owner of each important measure clear.
A useful metric reaches the person who can act on it. It does not sit unnoticed in another dashboard.
Your team owns the pipelines, warehouse and rules. We document the work and hand it over properly.
Pick one recurring decision. Score the evidence you have today, rather than the department's overall maturity or the neatness of its reports. A useful first data product has a named user, a shared definition, accessible records and a clear action at the end.
Every slider starts at 1, which means the assumption is unproven. Score the evidence from the people who make the decision and the records they use. A neat report is not evidence by itself.
The definitions and ownership are still too uncertain for a reliable build. Name one decision, the person making it and the records they trust. Then agree how you will judge data quality.
Send the result and your optional context to ORBN for a personal response.
Use this score to guide an early conversation. It is not a data protection, statistical or architecture assessment. A serious legal, quality or access constraint can outweigh the total.
Strategy, engineering, BI and analytics overlap, but they solve different problems. Start with the missing capability before choosing a warehouse, dashboard tool or AI model.
Scroll horizontally to compare the work →
| Capability | Question it answers | Typical output | Failure to avoid |
|---|---|---|---|
| Data strategy | Where should we invest, in what order and who must own it? | Decision map, principles, target capabilities, governance and prioritised roadmap | A technology target with no business decision or delivery evidence |
| Data engineering | How will trustworthy data arrive and remain operable? | Ingestion, transformation, storage, tests, metadata, monitoring and runbooks | Pipelines that move bad data faster but cannot be recovered |
| Business intelligence | Which recurring measures must users monitor and explore? | Metric definitions, semantic model, reports, dashboards and access | Polished charts built on disputed definitions or manual refreshes |
| Operational analytics | What should a person notice or do while work is still in progress? | Alerts, exception queues, embedded metrics and decision support | Insight isolated from the user, context and action it should change |
| Data governance | Who owns meaning, quality, access and change? | Stewardship, catalogue, lineage, quality rules, controls and lifecycle | Policies without owners, evidence or a practical route for exceptions |
| Forecasting or AI | Can history or unstructured information improve a defined outcome? | Evaluation set, features or retrieval data, model and monitored workflow | A model selected before the baseline, data rights or decision are clear |
Different systems can own different records. For every important measure, people need to know the source, the definition, when it becomes valid and who resolves a disagreement.
Name the person, cadence, question, available actions and consequence of making the decision late or incorrectly.
Specify the event or entity represented, formula, unit, time zone, inclusions, exclusions and treatment of reversals or missing values.
Identify the authoritative record, transformations, matching rules and every dependency between collection and the number a user sees.
Set fit-for-purpose expectations for completeness, validity, uniqueness, timeliness and accuracy, then show known gaps to the user.
Document purpose, permitted users, sensitivity, retention, sharing, deletion and the evidence needed for accountable use.
Place the answer where work happens, capture corrections and measure whether the intended decision or operational outcome changed.
Watch how people make the decision today. Record the timing, workarounds and competing reports, then inspect the source systems, identifiers, history, access and known defects using representative records.
Define the measure, grain, lineage, quality, freshness and known limits with the people who produce and use the data.
Use real examples to test the uncertain source, matching rule, history, volume or latency before committing to a large platform design.
Deliver the pipeline, model, quality checks and smallest useful interface together. A named user should be able to make the decision and correct exceptions.
Set access, alerts, recovery and support before release. Train users, publish the definitions and limits, then track freshness, quality, adoption and the business result before adding more.
Controls should match the use, sensitivity and cost of an error. Before a report, alert or model becomes part of daily work, make these responsibilities visible and give each one an owner.
State the decision this product supports, who owns its meaning and quality, who may use it and where someone can question the result.
Version the definitions and transformations so a published value can be traced to its source. Validate data before and after transformation, route exceptions to an owner and show known limits to users.
Use only the data the purpose needs. Separate service and user access, protect sensitive fields, record accountable use and define retention and deletion from the start.
Monitor source availability, job health, record counts, quality and freshness. Alert an owner, document recovery and backfill, review source or definition changes, and retire duplicated outputs when responsibility moves.
The UK Government's Data Quality Framework defines quality in relation to purpose and recommends that teams assign ownership, assess quality throughout the lifecycle and explain it to users. The ICO's guidance on data protection by design and by default says data protection should begin at the planning stage and continue throughout the lifecycle. The AWS Well-Architected Data Analytics Lens covers the design and operation of analytics workloads in AWS. These resources are useful starting points, but they do not replace legal, statistical or sector-specific review.
Counting dashboards will not give you a useful estimate. Cost comes from the condition of the sources, the history you need, disputed definitions, privacy and security work, and the support people will need once they depend on the answer.
We identify the priority decision and its users, inspect sample records, establish a quality baseline and set out a sequenced roadmap.
We test the hardest source and transformation, build the metric model and put it inside a useful report or workflow. The result gives us evidence for the production architecture.
We add the remaining pipelines and history, then set up access, monitoring, recovery, support and controlled changes to definitions.
A focused assessment can move in weeks when the right people and sample records are available. Rebuilding years of inconsistent history or coordinating an enterprise platform takes longer. Use the UK software delivery cost estimator to test the team, duration and risk assumptions behind a proposal.
Crowlite connects order intake, warehouse picking, route planning and reporting in one system. Owners can inspect sales and margin while teams work from the same order and fulfilment records. Its route-planning product cut planning for more than 200 daily orders from as much as eight hours to under 20 minutes.
Read the Crowbond route optimisation case study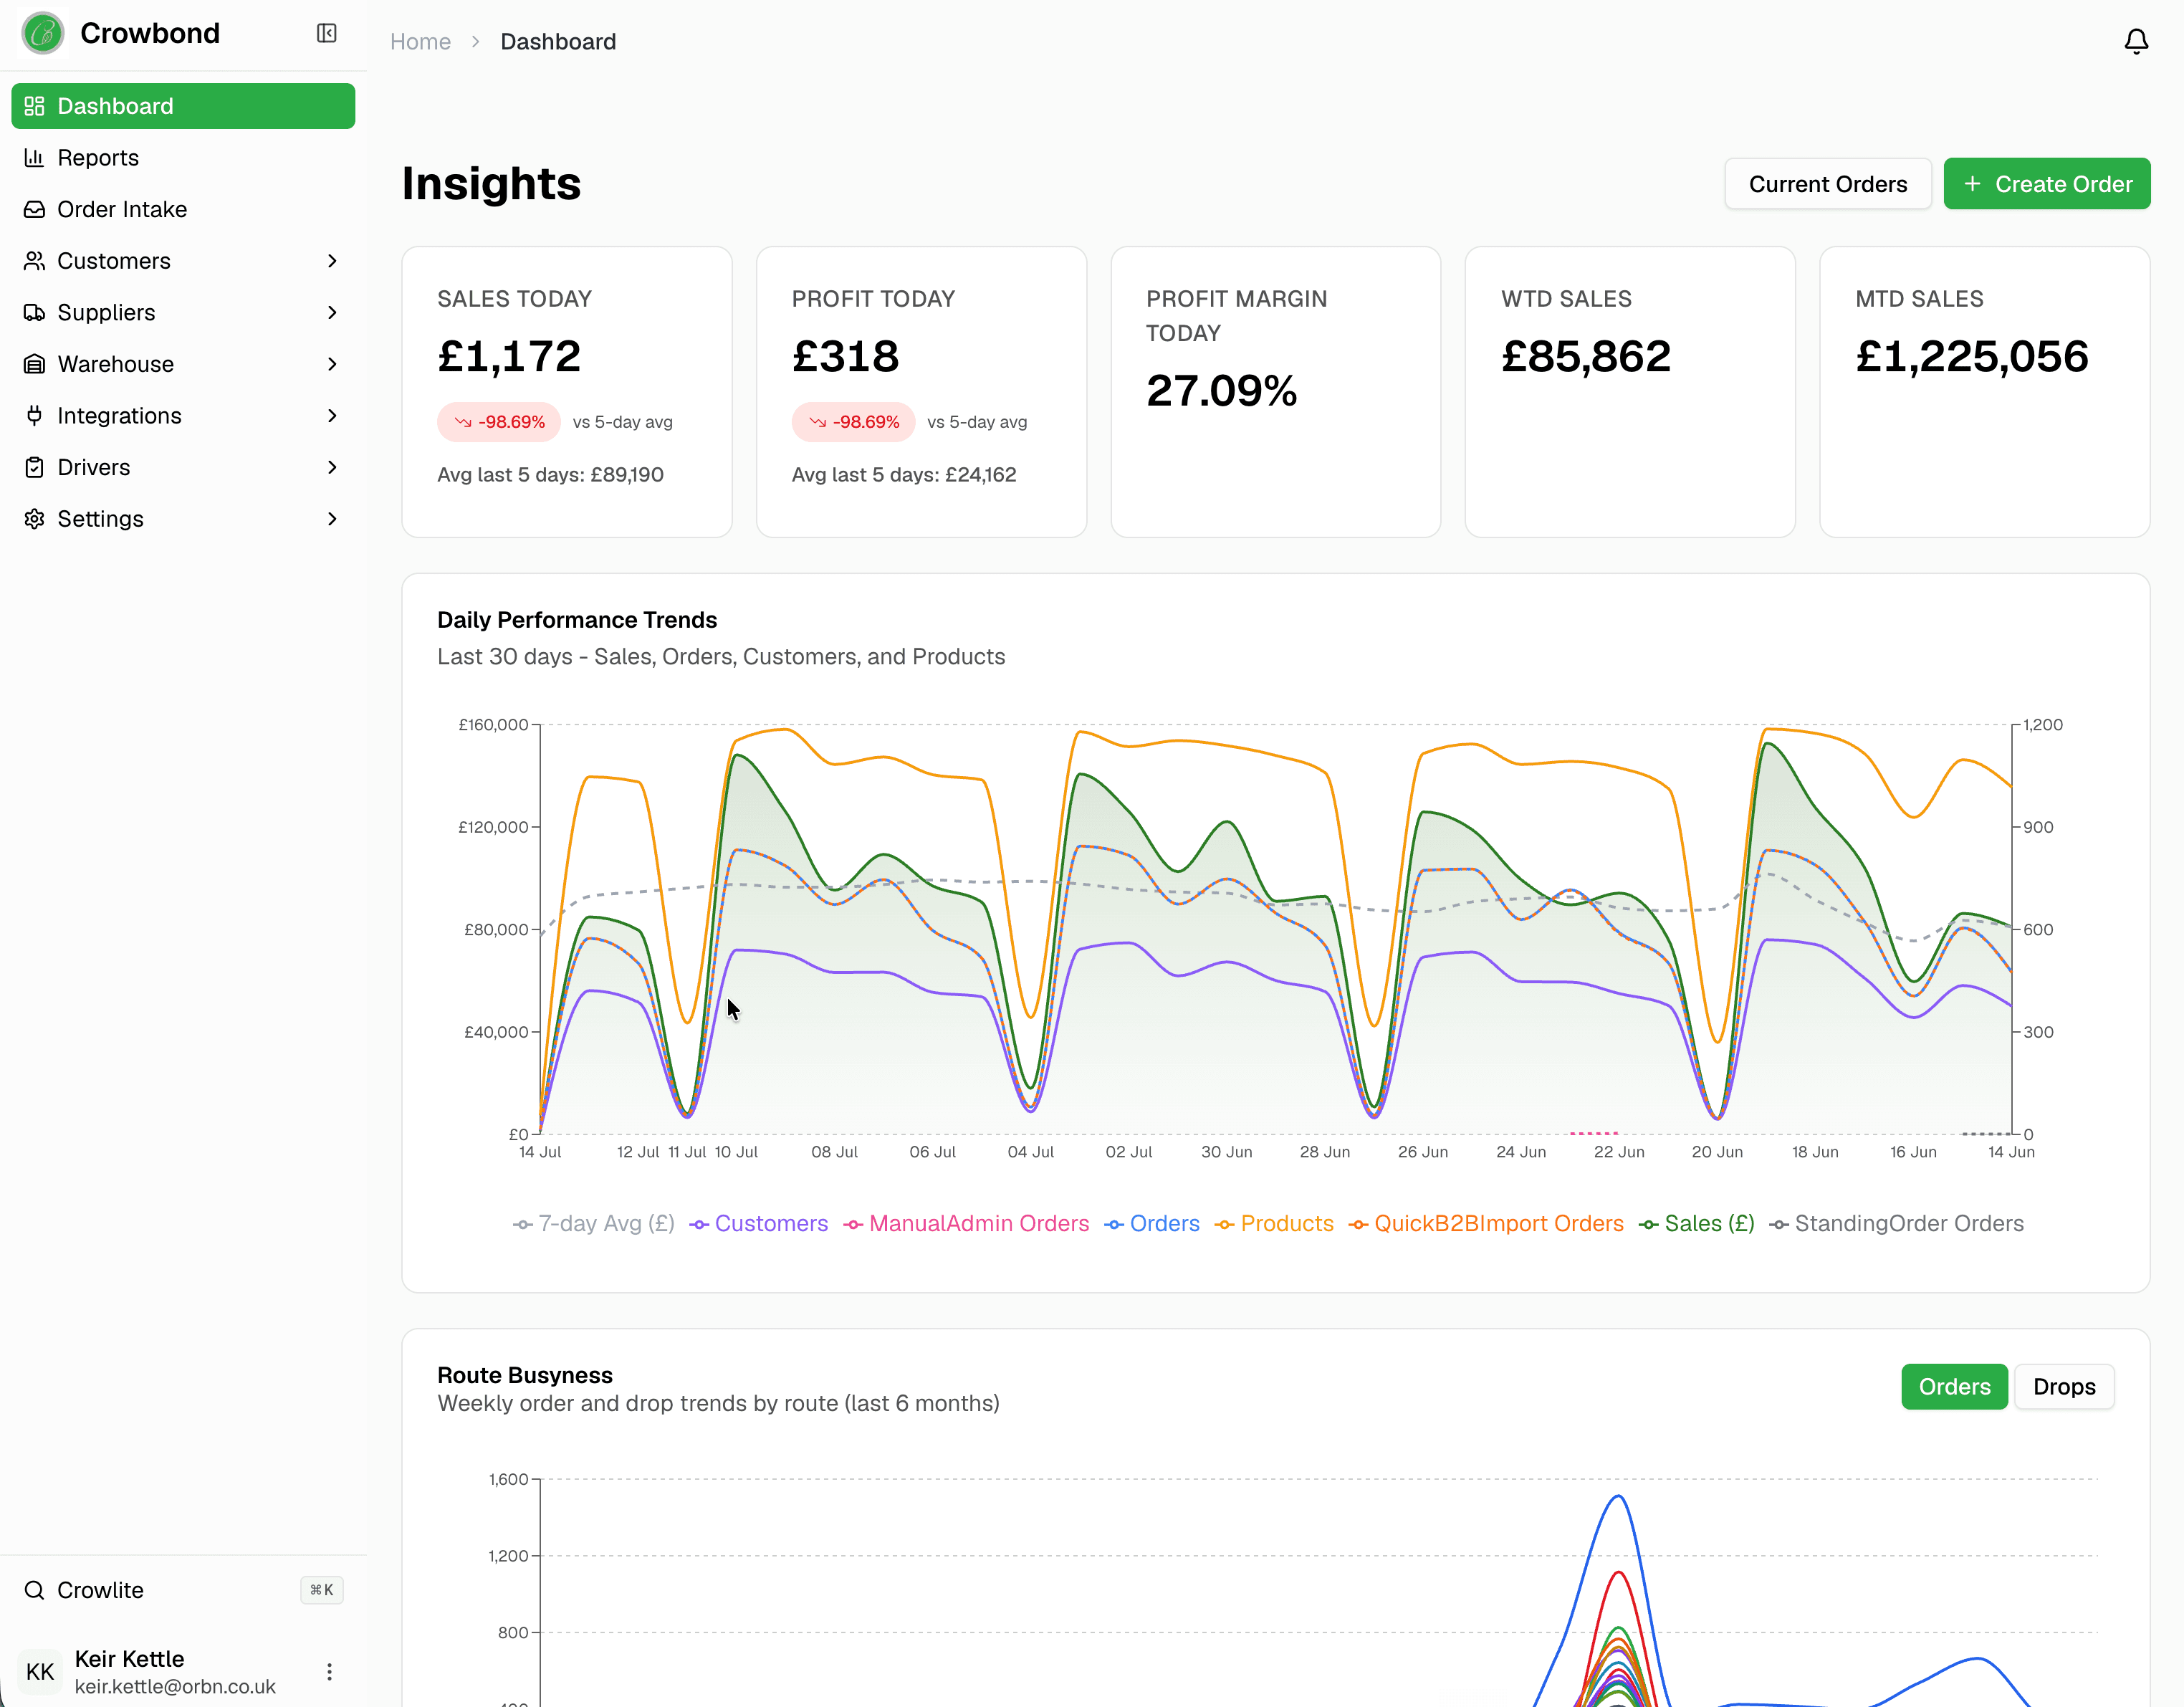
These route-planning results are from this engagement. Results will vary with the operation, workflow and starting point.
DeskBook combines timesheets, work in progress, project budgets and rate assumptions for architecture practices. Each morning it points out the jobs that need attention and keeps the source records visible to the person making the decision. The data foundation and AI interface work as one product.
Explore AI automation and custom AI development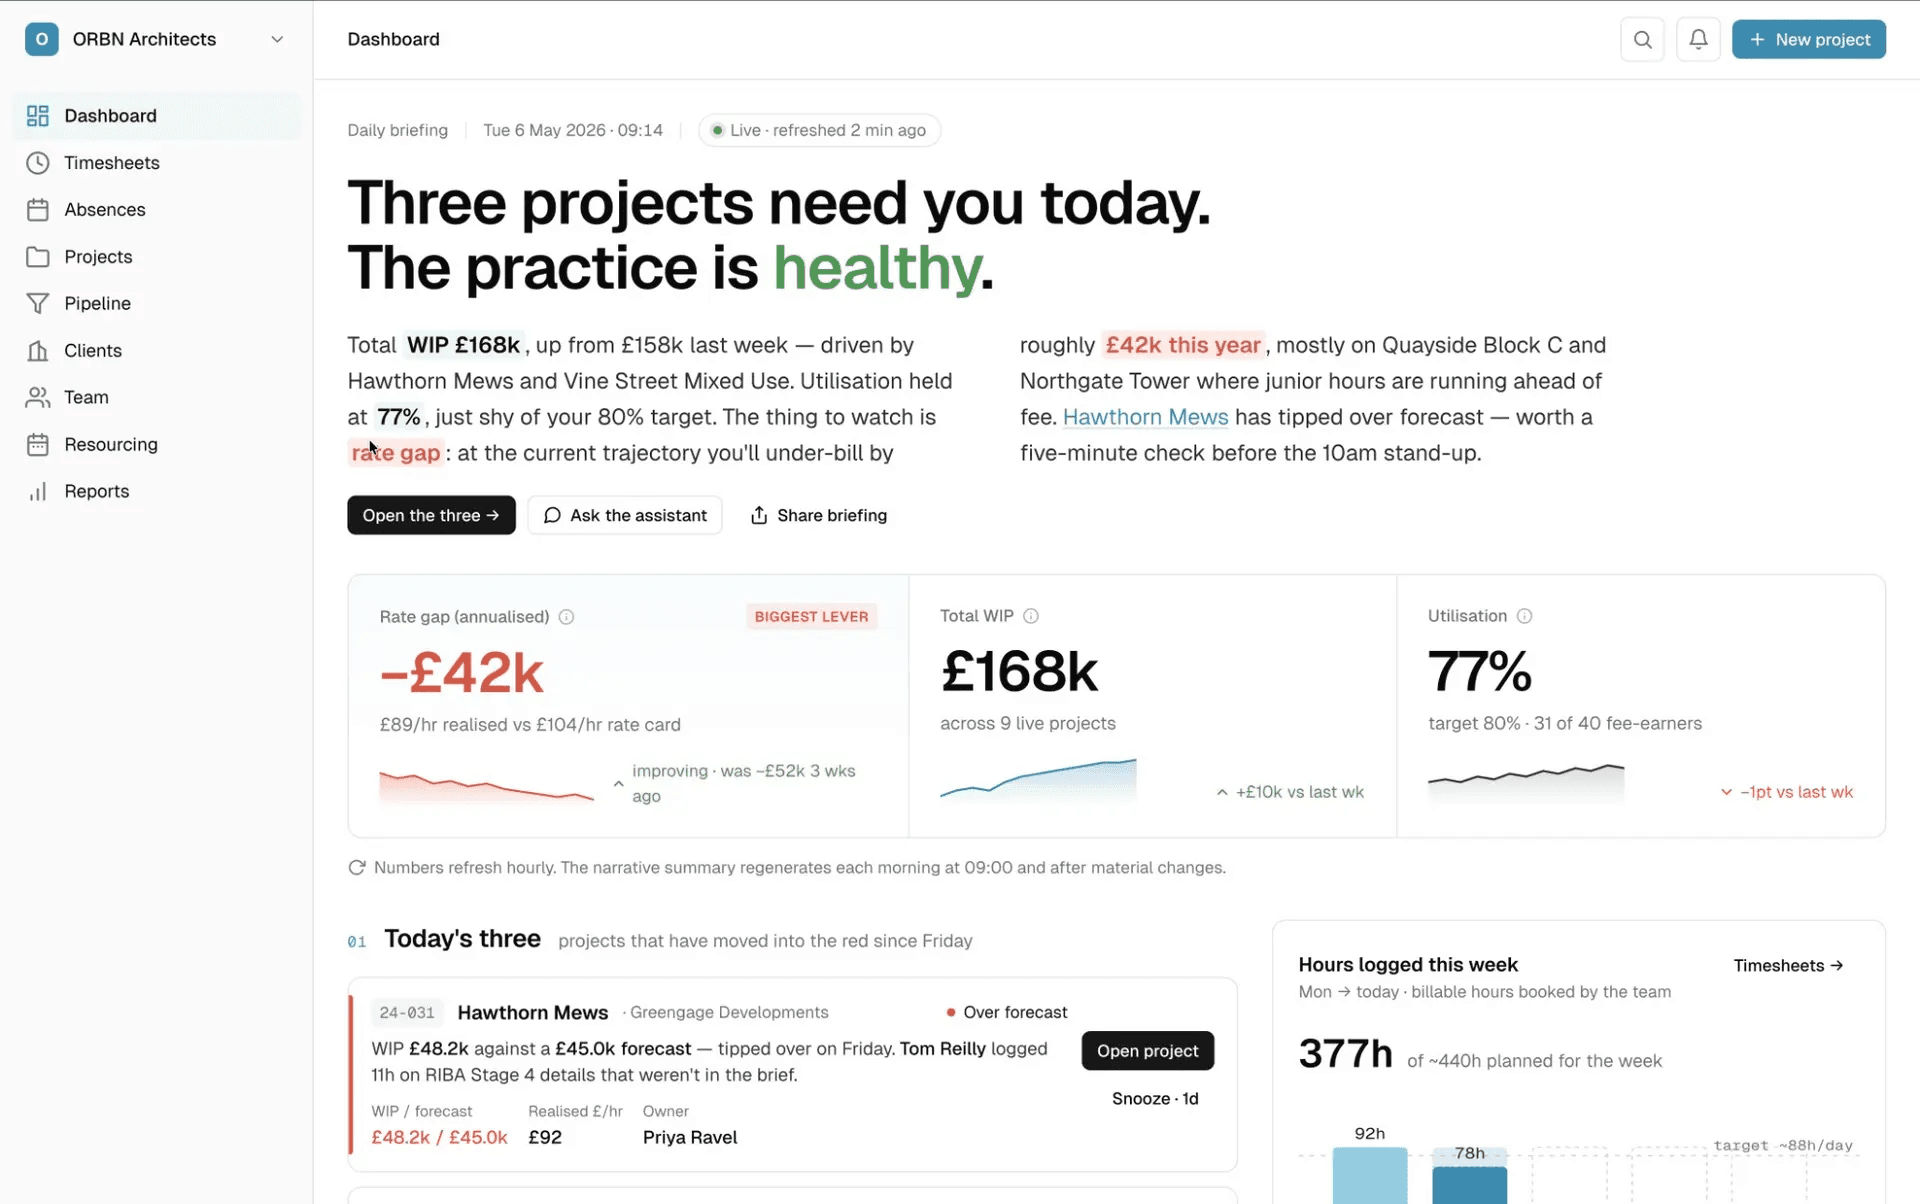
A data strategy sets out which decisions matter and what data work will support them. It names the source records, definitions, owners, quality standard, access rules, architecture and delivery order. This gives the team a practical plan for investment and day-to-day operation, rather than a vague promise to become data driven.
A data strategy consultant studies how people make decisions and produce reports today. They inspect the relevant systems and records, settle definitions and ownership, assess quality and access, then set out the order of work. ORBN can also build the pipelines, models, reports and operational software, so the advice gets tested through a focused data product.
It depends on the job. A warehouse can help when you need to combine several systems, preserve history or keep heavy analysis away from operational software. For a narrow use case, a source-system report, reporting database, semantic model or API may be simpler. The decision, data volume, freshness and access needs should determine the architecture.
Data engineering collects, transforms, tests and stores data so people can depend on it. Business intelligence provides shared metrics, reports and dashboards. Data analytics investigates a specific question and may use statistical or predictive methods. A production data product often combines all three, with a clear owner and a place for someone to act on the result.
Cost depends on the decision, the number and condition of the sources, the history you need, security requirements and the production work involved. A useful proposal separates discovery, the hardest data proof, the build and ongoing operation. ORBN does not publish one fixed price because a single operational metric and an organisation-wide platform are very different projects.
A focused assessment can produce a decision map and a useful first recommendation in weeks when the right people and sample data are available. A production data product takes longer if sources are hard to reach, definitions are disputed, history needs rebuilding or personal data is involved. The initial plan should make those conditions visible instead of hiding them inside a generic transformation timeline.
First define what good enough means for the decision, then measure it. Find where defects enter the process and fix them as close to the source as practical. Validation, exception queues, ownership and monitoring stop the work from becoming another one-off clean-up. Keep known limits beside the metric so users can judge whether the data is suitable.
You do not need an enterprise data programme before every AI pilot. You do need clear data rights, representative examples, reliable context, quality expectations and an owner for the chosen workflow. Retrieval, forecasting and automated decisions cannot fix disputed definitions or inaccessible records. A focused data product and evaluation set are often the best preparation for production AI.
The first data product can expose an integration gap, a legacy constraint or a workflow that needs custom software. If the evidence is ready for a model, the same definitions, access rules and ownership can support a focused AI pilot.
Design monitored data flows across ERP, WMS, ecommerce, CRM, EDI and legacy software.
R/02Score a use case and build evaluated AI around permissioned operational data.
R/03Put the metric, exception or decision inside a workflow users can own.
R/04Assess whether to retain, wrap, replatform, replace or rebuild the systems behind the data.
We will trace the definitions and source records, find the weakest assumption and identify the smallest evidence-producing step.